New SolidWorks weekend intake starts 18 Aug — limited seats available.

03-8063 0414

Learning Paths

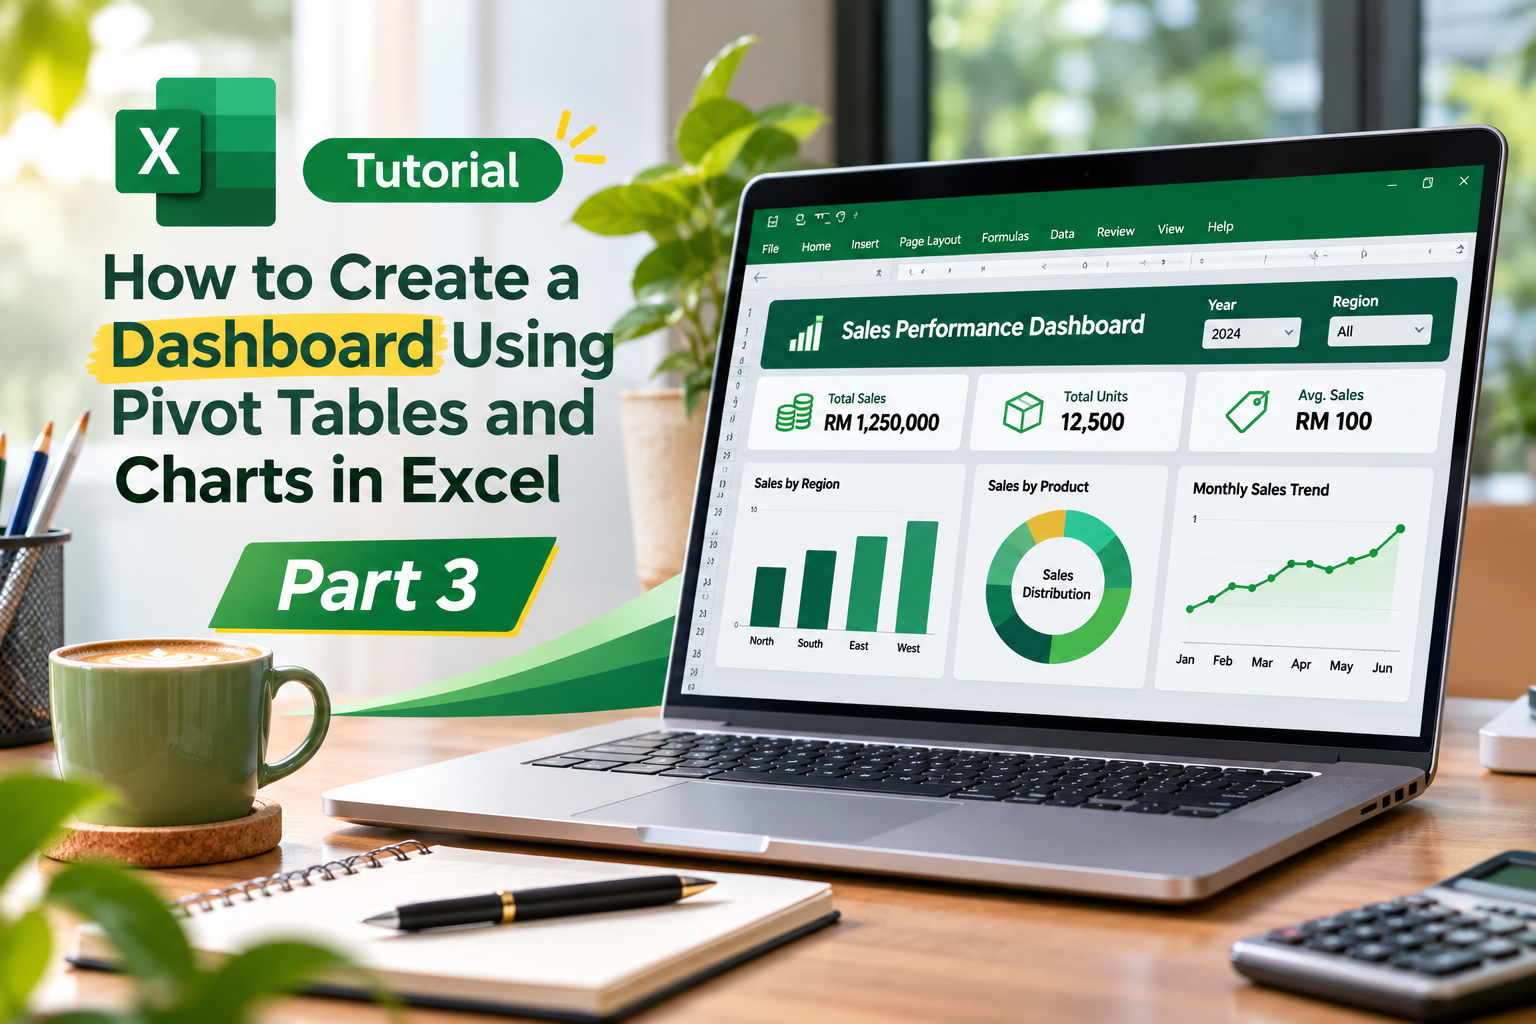
Tutorial:How to Create a Dashboard Using Pivot Tables and Charts in Excel (Part 3)

Master Pivot Tables, charts, and data visualisation in Excel – Part 3

WhatsApp LinkedIn
Excel dashboard tutorial featuring Pivot Tables, charts, and sales insights
Turn Excel data into powerful, interactive dashboards.

Tutorial:How to Create a Dashboard Using Pivot Tables and Charts in Excel (Part 3)

You will learn how to: Group dates into months and years to create a time series trend chart Group amounts to create a distribution (histogram) chart. Add slicers to your pivot tables and charts to make them interactive. Lots of tips and shortcuts for formatting your charts.

https://youtu.be/FyggutiBKvU?si=ARtif9yyCmB2_qxD
More notes from the same learning path.

4 Nov 2026 · Admin Joe Use of Advanced Excel Features for the Sales and Marketing Profession – Live Interview with Angeline Joseph 4 Nov 2026 · Admin Joe Advanced Excel and Powerpoint Final – Live Interview with Kerrey Ooi 4 Nov 2026 · Admin Joe Top 10 Terms Project Managers Use