New SolidWorks weekend intake starts 18 Aug — limited seats available.

03-8063 0414

Excel & Data Analytics

Microsoft Excel Power Pivot, Power Query and Dashboards

Improve your Excel data analysis skills with our 2-day, HRD Corp claimable Microsoft Excel Power Pivot, Power Query and Dashboards Training Course at CAD Training Centre. Master data cleaning, modelling, DAX, and interactive dashboards to automate preparation and build reports. Physical, online, and in-house classes available.

  • Duration 2 Days
  • Level Intermediate
  • Format Face-to-face

About this course

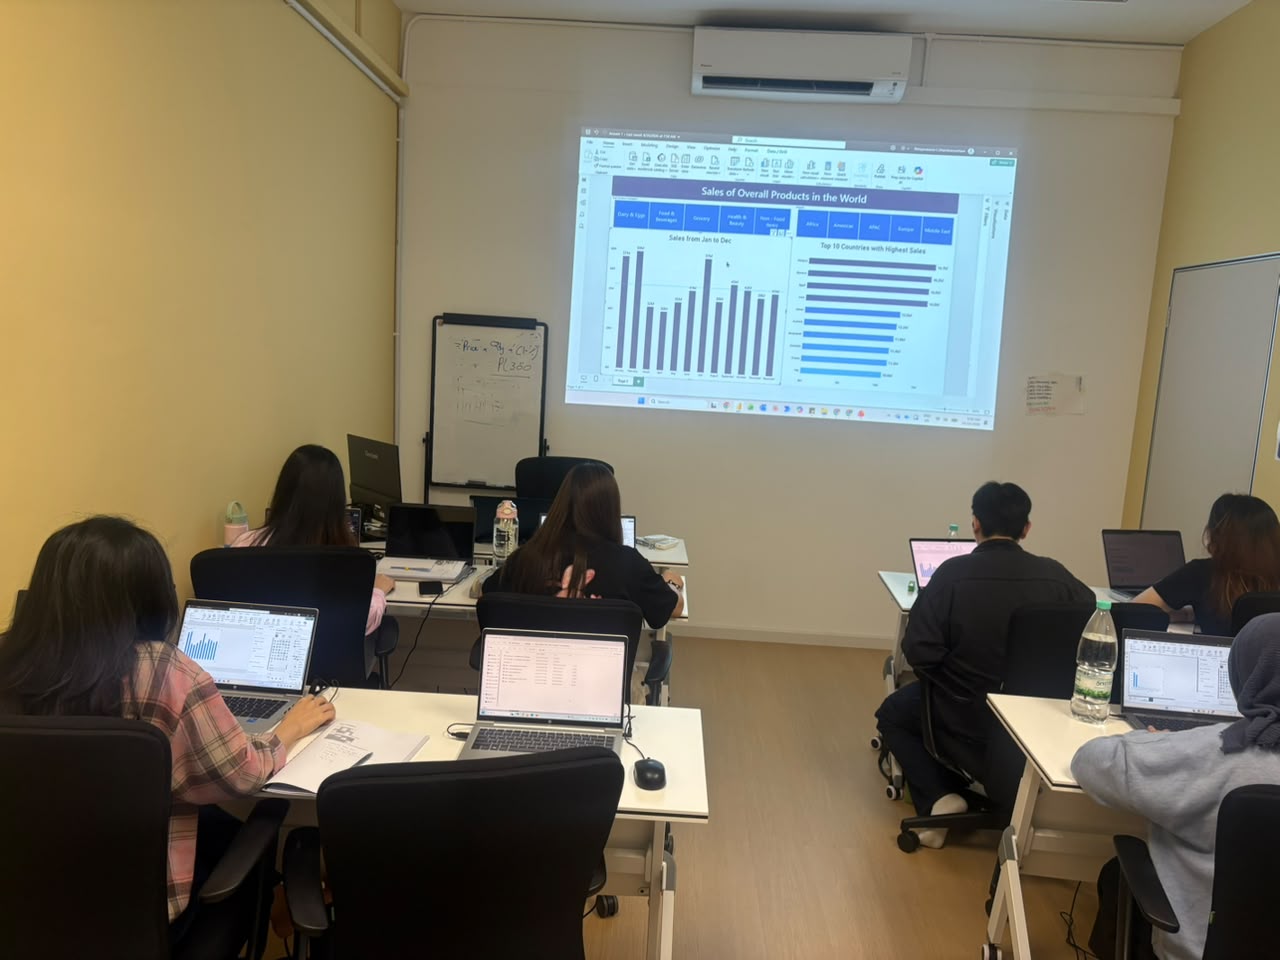
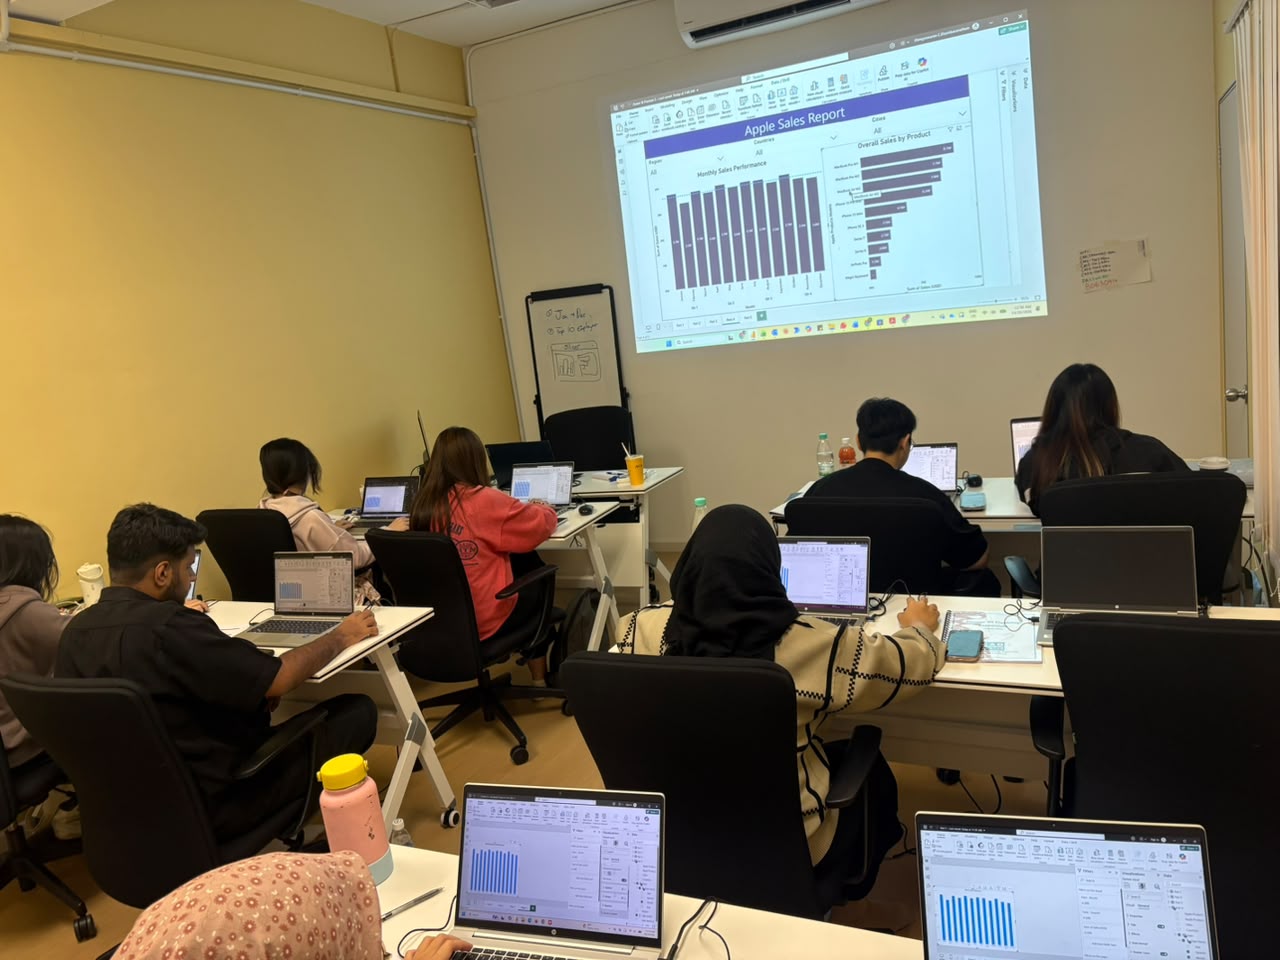
The Ultimate Excel Power Query, Power Pivot & Dashboard Training Course at CAD Training Centre is a comprehensive, HRD Corp claimable program designed for data analysts and corporate professionals in Malaysia. Master massive data automation, relational data modeling, and interactive business dashboards through hands-on, expert-led training available physically in Puchong or via live online sessions. Certificate after completion. Laptop provided for physical training. Free Repeat classes after training. Beginner Friendly, hands-on Practical Course.

Dive into the functionalities of these tools to help you better understand and utilize Excel for data analysis and visualization. Whether you’re a beginner seeking to improve your spreadsheet skills or a seasoned user wanting to explore advanced features, we’ll walk you through the ins and outs of Dashboard, Power Pivot and Power Query.

Discover how to transform raw data into meaningful insights and create effective dashboards. Understand the process of building relationships between data tables, creating calculated columns, and using Data Analysis Expressions (DAX). Learn how to connect to various data sources, clean and transform data, and create seamless workflows. Whether you’re dealing with large datasets or multiple sources

This course covers four modules focusing on Power Query, beginning with importing data from Excel files, websites, CSV files, Access databases and text files. Participants will then learn how to clean and transform data, append and merge tables, load information into Excel and the Data Model, and work with the Power Query Formula Language. Day 2 introduces four additional modules covering Power Pivot, data modelling, table relationships, calculated columns, measures and Data Analysis Expressions (DAX). Participants will also learn how to create PivotTables, PivotCharts, slicers and timelines to develop interactive dashboards for analysing business performance

Sessions run 9am–5pm at our Puchong training centre.

Related Links
https://support.microsoft.com/en-us/excel/how-power-query-and-power-pivot-work-together
https://pcwebinars.com/the_benefits_of_using_powerquery_and_powerpivot_within_excel/
https://www.youtube.com/watch?v=9TmWdX2N0bo
https://www.youtube.com/watch?v=2btS31AU3Iw

Learning Outcomes

  • Understand the fundamentals of Power Query and Power Pivot and how they support data analysis and reporting in Microsoft Excel.
  • Import and combine data from multiple sources, including Excel files, CSV files, websites, Access databases and text files.
  • Clean, transform and restructure datasets using Power Query to prepare accurate information for reporting.
  • Apply Power Query techniques such as appending, merging, changing data formats and creating formulas.
  • Load transformed data into Excel tables and the Data Model for further analysis.
  • Build relationships between multiple tables using Power Pivot to manage and analyse large datasets.
  • Create calculated columns and measures using Power Pivot and understand the fundamentals of Data Analysis Expressions (DAX).
  • Develop interactive Excel dashboards using PivotTables, PivotCharts, slicers and timelines to analyse business performance.

Who is it for

  • Business analysts and data analysts who want to improve data preparation, modelling and reporting using Microsoft Excel.
  • Finance and accounting professionals who manage financial information, business reports and large datasets.
  • Sales and marketing professionals who need to consolidate customer information, analyse sales performance and prepare interactive reports.
  • Administrative and operations personnel who regularly combine data from multiple worksheets and workbooks.
  • Project managers and business executives who use Excel dashboards to monitor performance and support decision-making.
  • Existing Microsoft Excel users who want to progress beyond basic formulas and PivotTables into Power Query, Power Pivot and dashboard development.

Course outline

Module 1

Day 1 — Extract Data from Multiple Sources

  • Understanding the installation steps for Power Query
  • Importing data from Microsoft Excel files
  • Importing data from websites
  • Importing data from CSV files
  • Importing data from Microsoft Access databases, Importing data from text files
  • Refreshing imported data to update information
Module 2

Transform Data

  • Cleaning dirty and inconsistent datasets
  • Defining and changing data formats
  • Renaming columns for better data organisation
  • Appending data from different tables
  • Merging two or more tables to combine related information
Module 3

Load Data

  • Loading cleaned and transformed data into Microsoft Excel
  • Loading data into the Excel Data Model
  • Understanding how transformed information can be prepared for further analysis
Module 4

Power Query Formula Language

  • Introduction to the Power Query Formula Language
  • Understanding the Power Query Advanced Editor
  • Creating simple formulas for data transformation
  • Creating formula functions within Power Query
Module 5

Day 2 -Introduction to Power Pivot

  • Understanding the installation steps for Power Pivot
  • Exploring the limitations of normal Excel PivotTables
  • Navigating the Power Pivot interface
  • Importing external data from multiple sources
  • Working with client databases
  • Importing data from Excel tables
  • Importing data from CSV files
Module 6

Building Your Data Model and Linking

  • Handling large datasets from multiple Excel worksheets
  • Creating relationships between multiple data tables
  • Understanding how related tables work together in a Data Model
  • Developing user-friendly data models for reporting and analysis
Module 7

Custom Columns and Calculations

  • Performing calculations using Power Pivot
  • Creating calculated columns
  • Creating measures and calculated fields
  • Creating PivotTables and PivotCharts
  • Introduction to Data Analysis Expressions (DAX)
Module 8

Presentation Using PivotTable and Chart

  • Introduction to Excel dashboards
  • Creating PivotTables based on the Data Model
  • Displaying related information from different data sources in one table
  • Using slicers to interactively filter information
  • Working with timelines for date-based filtering
  • Creating Pivot Charts for data visualisation
  • Presenting data through interactive Excel dashboards

Course format

Choose the delivery mode that fits your team and timeline.

  • 01

    Classroom

    Instructor-led sessions in our Bandar Puteri labs with guided exercises, live demos, and peer discussion.

  • 02

    Online

    Live virtual delivery with the same syllabus, shared files, and instructor checkpoints — ideal for distributed teams.

  • 03

    In-house

    Private cohorts for your organisation, scheduled around project deadlines with content tailored to your standards.

Upcoming schedule

Public intakes coming up.

  • 3 Dec 2026 - 4 Dec 2026 9:00 AM – 5:00 PM · Face-to-face

Certification & policies

Certificate of attendance

Receive a certificate of attendance upon completing the programme, suitable for HR records and continuous learning portfolios.

Free Repeat Class

Free Repeat Class: if you need another pass at the same public syllabus within 6 months, you may re-attend subject to seat availability.

Materials provided

  • Course workbook / digital notes
  • Exercise files and sample templates
  • Certificate of attendance
  • Post-class support window for clarification questions

Frequently asked questions

01 What is the Microsoft Excel Power Pivot, Power Query and Dashboards course about?

Our Microsoft Excel Power Pivot, Power Query and Dashboards Training Course helps participants learn how to import, clean, transform and analyse data using advanced Excel tools. The programme covers Power Query for preparing data, Power Pivot for building relationships and performing calculations, and Excel dashboards for presenting information visually. Participants will learn how to create interactive reports that support business analysis and decision-making.

02 Is the Power Pivot, Power Query and Dashboards course suitable for beginners?

This course is suitable for participants who already have basic knowledge of Microsoft Excel charts, PivotTables, functions and formulas. You do not need prior experience with Power Query or Power Pivot, as the course introduces these tools before progressing to data modelling and dashboard development. If you are completely new to Excel, we recommend completing the Microsoft Excel Basics, Intermediate or Advanced training first.

03 What is the difference between Power Query, Power Pivot and Excel Dashboards?

Power Query is used to import, clean and transform data from different sources. It helps prepare information for analysis without repeatedly performing the same manual data preparation tasks. Power Pivot is used to create relationships between multiple tables, manage large datasets and perform calculations using calculated columns, measures and DAX. Excel Dashboards use tools such as PivotTables, PivotCharts, slicers and timelines to present information visually and allow users to explore business performance interactively.

04 Do I need to bring my own laptop or purchase Microsoft Excel software?

No. CAD Training Centre provides laptops with Microsoft Excel installed for participants attending physical classes at our Puchong centre. You may bring your own laptop if preferred but you must have the Microsoft Excel Software . A training handbook is also provided for reference.

05 Will I receive a certificate after completing the Power Pivot, Power Query and Dashboards course?

Yes. Participants receive a Certificate of Achievement upon completing the Microsoft Excel Power Pivot, Power Query and Dashboards Training Course. This recognises their completion of the 2-day programme covering data preparation, modelling, calculations and interactive dashboard development.

06 What language is the Power Pivot, Power Query and Dashboards course conducted in?

The training is conducted bilingually in English and Bahasa Melayu.

07 Is the Power Pivot, Power Query and Dashboards training HRD Corp claimable?

Yes. Our Microsoft Excel Power Pivot, Power Query and Dashboards Training Course is HRD Corp claimable under the SBL Khas scheme, subject to applicable eligibility and approval requirements.

08 Is there a surau (prayer room) available at CAD Training Centre?

Yes, we have a surau available at our training centre in Puchong. Muslim participants can use the prayer room during breaks throughout the training day.

09 Can I attend the Power Pivot, Power Query and Dashboards training online instead of in a classroom?

Classroom training means physical attendance in Puchong with face-to-face guidance and co-learning with other participants. Online training runs live via Zoom with hands-on, screen-shared exercises, better if you're outside the Klang Valley or want to save on travel time.

10 Can I repeat the Power Pivot, Power Query and Dashboards course if I need more practice?

Yes, free repeat classes are offered, no questions asked, if you need a refresher.

Next step

Register your interest

Share a few details and we will confirm seats, HRD Corp claimability, and the best public or in-house option for this course.

Training type