About this course
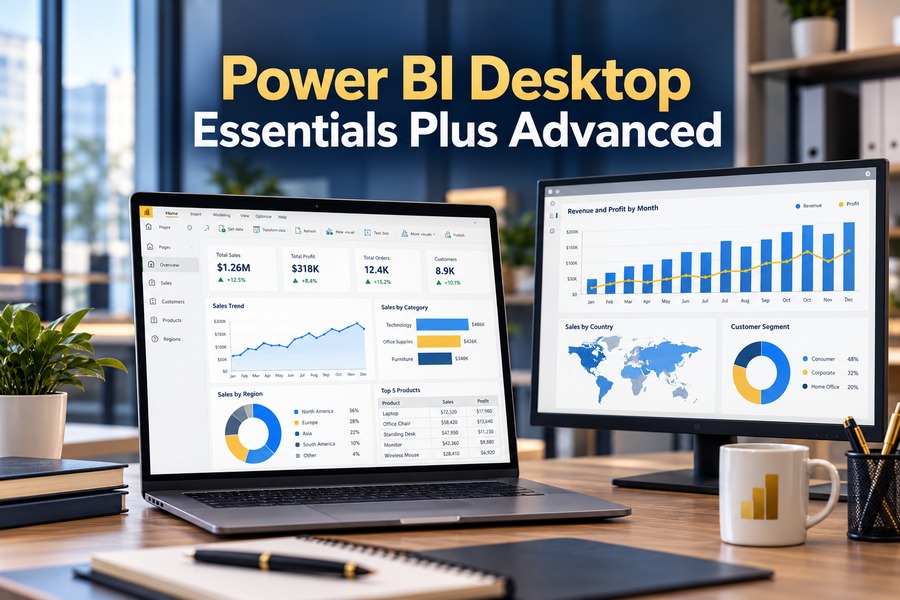
The Power BI Training Course at CAD Training Centre is a very comprehensive, HRD Corp claimable program designed for business analysts and corporate teams in Malaysia. Available in a flexible 2-day core essentials option or a 3-day masterclass (combining essentials with 1 day of advanced DAX and dashboard creation), this hands-on training is offered physically in Puchong, Selangor, or via live online sessions. Feeling frustrated and confused whenever using Power BI Desktop, but wish to learn how others are making visually appealing, complex multiple-page reports and dashboards. Well look no further than our Power BI Training
This course covers eight sections, beginning with an introduction to Power BI Desktop, its interface and installation process. Participants will learn how to create filled maps, use slicers and other visualisations, build single-page and multiple-page reports, and apply simple DAX measures. The day also introduces Power Query for cleaning and transforming data, including unpivoting columns. Day 2 builds on these foundations by exploring multiple-page report navigation, changing data sources, merging and appending queries, and creating relationships between tables. Participants will also learn about data modelling, cardinality, many-to-many relationships and handling messy datasets.
A “Start-from-zero” Course experience that will guide the participants through the basics to advanced concepts of Power BI Desktop, starting from how to install Power BI Desktop and creating basic reports using different visualizations.
Related Links
https://www.microsoft.com/en-my/power-platform/products/power-bi/desktop
https://www.techtarget.com/enterprise-software/definition/What-is-Microsoft-Power-BI-Uses-features-and-guide
https://www.tutorialspoint.com/power_bi/power_bi_quick_guide.html
https://www.onlc.com/blog/benefits-of-power-bi-career/
https://ttms.com/my/find-out-the-key-benefits-of-using-microsoft-power-bi/
Learning Outcomes
- Understand the fundamentals of Microsoft Power BI Desktop, including its interface, features and applications for business intelligence.
- Download, install and configure Power BI Desktop to create reports and visualisations.
- Create single-page and multiple-page reports using filled maps, slicers and other interactive visualisations.
- Apply simple Data Analysis Expressions (DAX) measures to perform calculations within Power BI reports.
- Import, clean and transform data using Power Query, including unpivoting columns and handling inconsistent datasets.
- Merge and append data from multiple sources to prepare information for reporting and analysis.
- Create and manage relationships between tables using data modelling concepts such as cardinality and many-to-many relationships.
- Develop structured Power BI reports that support data analysis, business performance monitoring and informed decision-making.