New SolidWorks weekend intake starts 18 Aug — limited seats available.

03-8063 0414

Learning Paths

Tutorial: Introduction to Pivot Tables, Charts, and Dashboards (Part 2)

Master Pivot Table calculations and keep your Excel dashboards up to date

WhatsApp LinkedIn
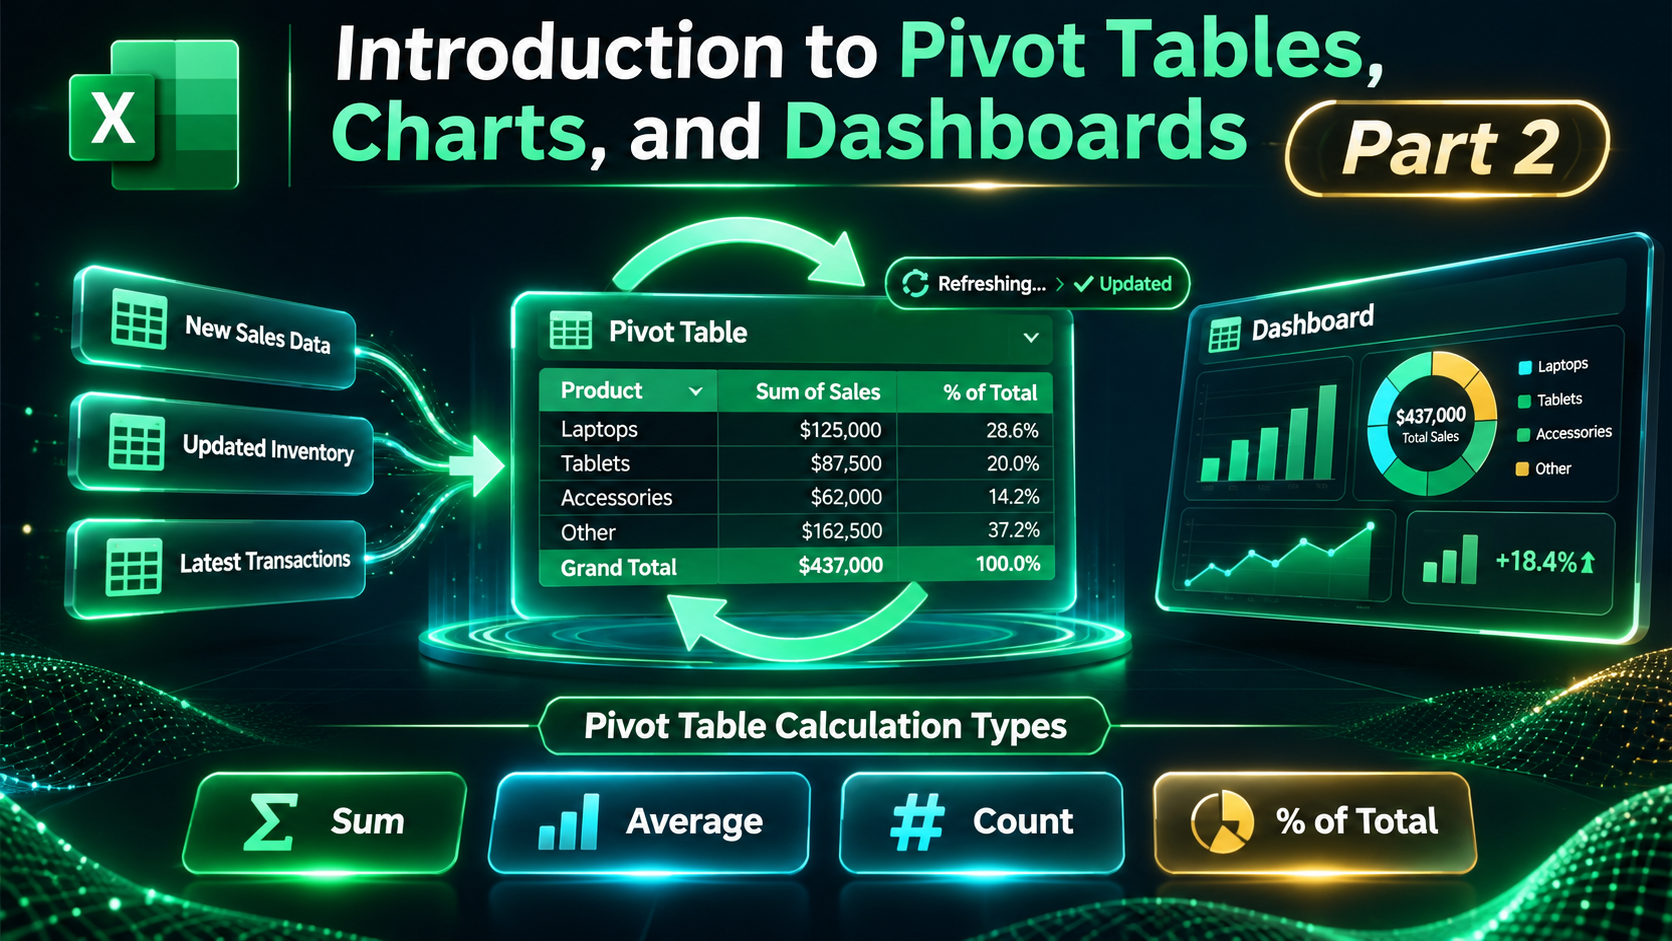
Excel Pivot Tables and dashboards showcasing data refresh, calculations, and updated business insights
Refresh Your Data. Unlock Smarter Insights.

Tutorial: Introduction to Pivot Tables, Charts, and Dashboards (Part 2) 

This is part 2 in the series on an introduction to pivot tables and dashboards.

In this video I explain some of the different pivot table calculation types. Learn how to calculate the average, count, sum, and percentage of total. I explain how to update your pivot table with more data, and also how to refresh your pivot tables. 

https://youtu.be/g530cnFfk8Y?si=iaWAqi_AcngToE10
More notes from the same learning path.

4 Nov 2026 · Admin Joe Use of Advanced Excel Features for the Sales and Marketing Profession – Live Interview with Angeline Joseph 4 Nov 2026 · Admin Joe Advanced Excel and Powerpoint Final – Live Interview with Kerrey Ooi 4 Nov 2026 · Admin Joe Top 10 Terms Project Managers Use